Edit chart
Loading graph
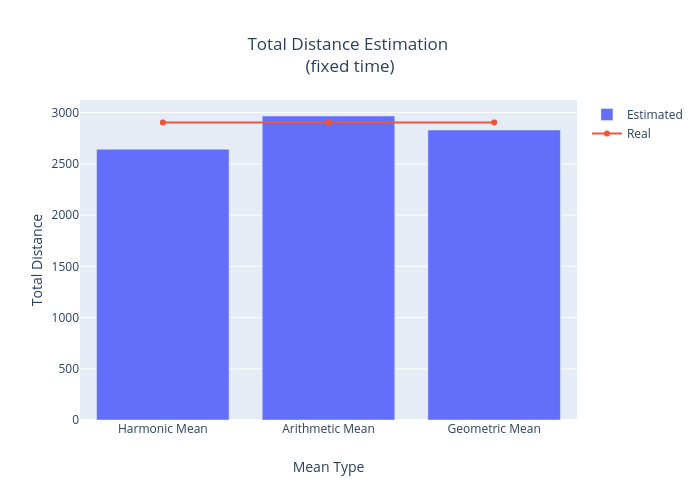
Aw1_mailinator's interactive graph and data of "Total Distance Estimation (fixed time)" is a bar chart, showing Estimated vs Real; with Mean Type in the x-axis and Total Distance in the y-axis.. The x-axis shows values from -0.5 to 2.5. The y-axis shows values from 0 to 3122.9261243844553.